Design — is a process of learning, ordering, and reducing entropy. In design, we manage the unknown, discover and structure it.

manageunknow

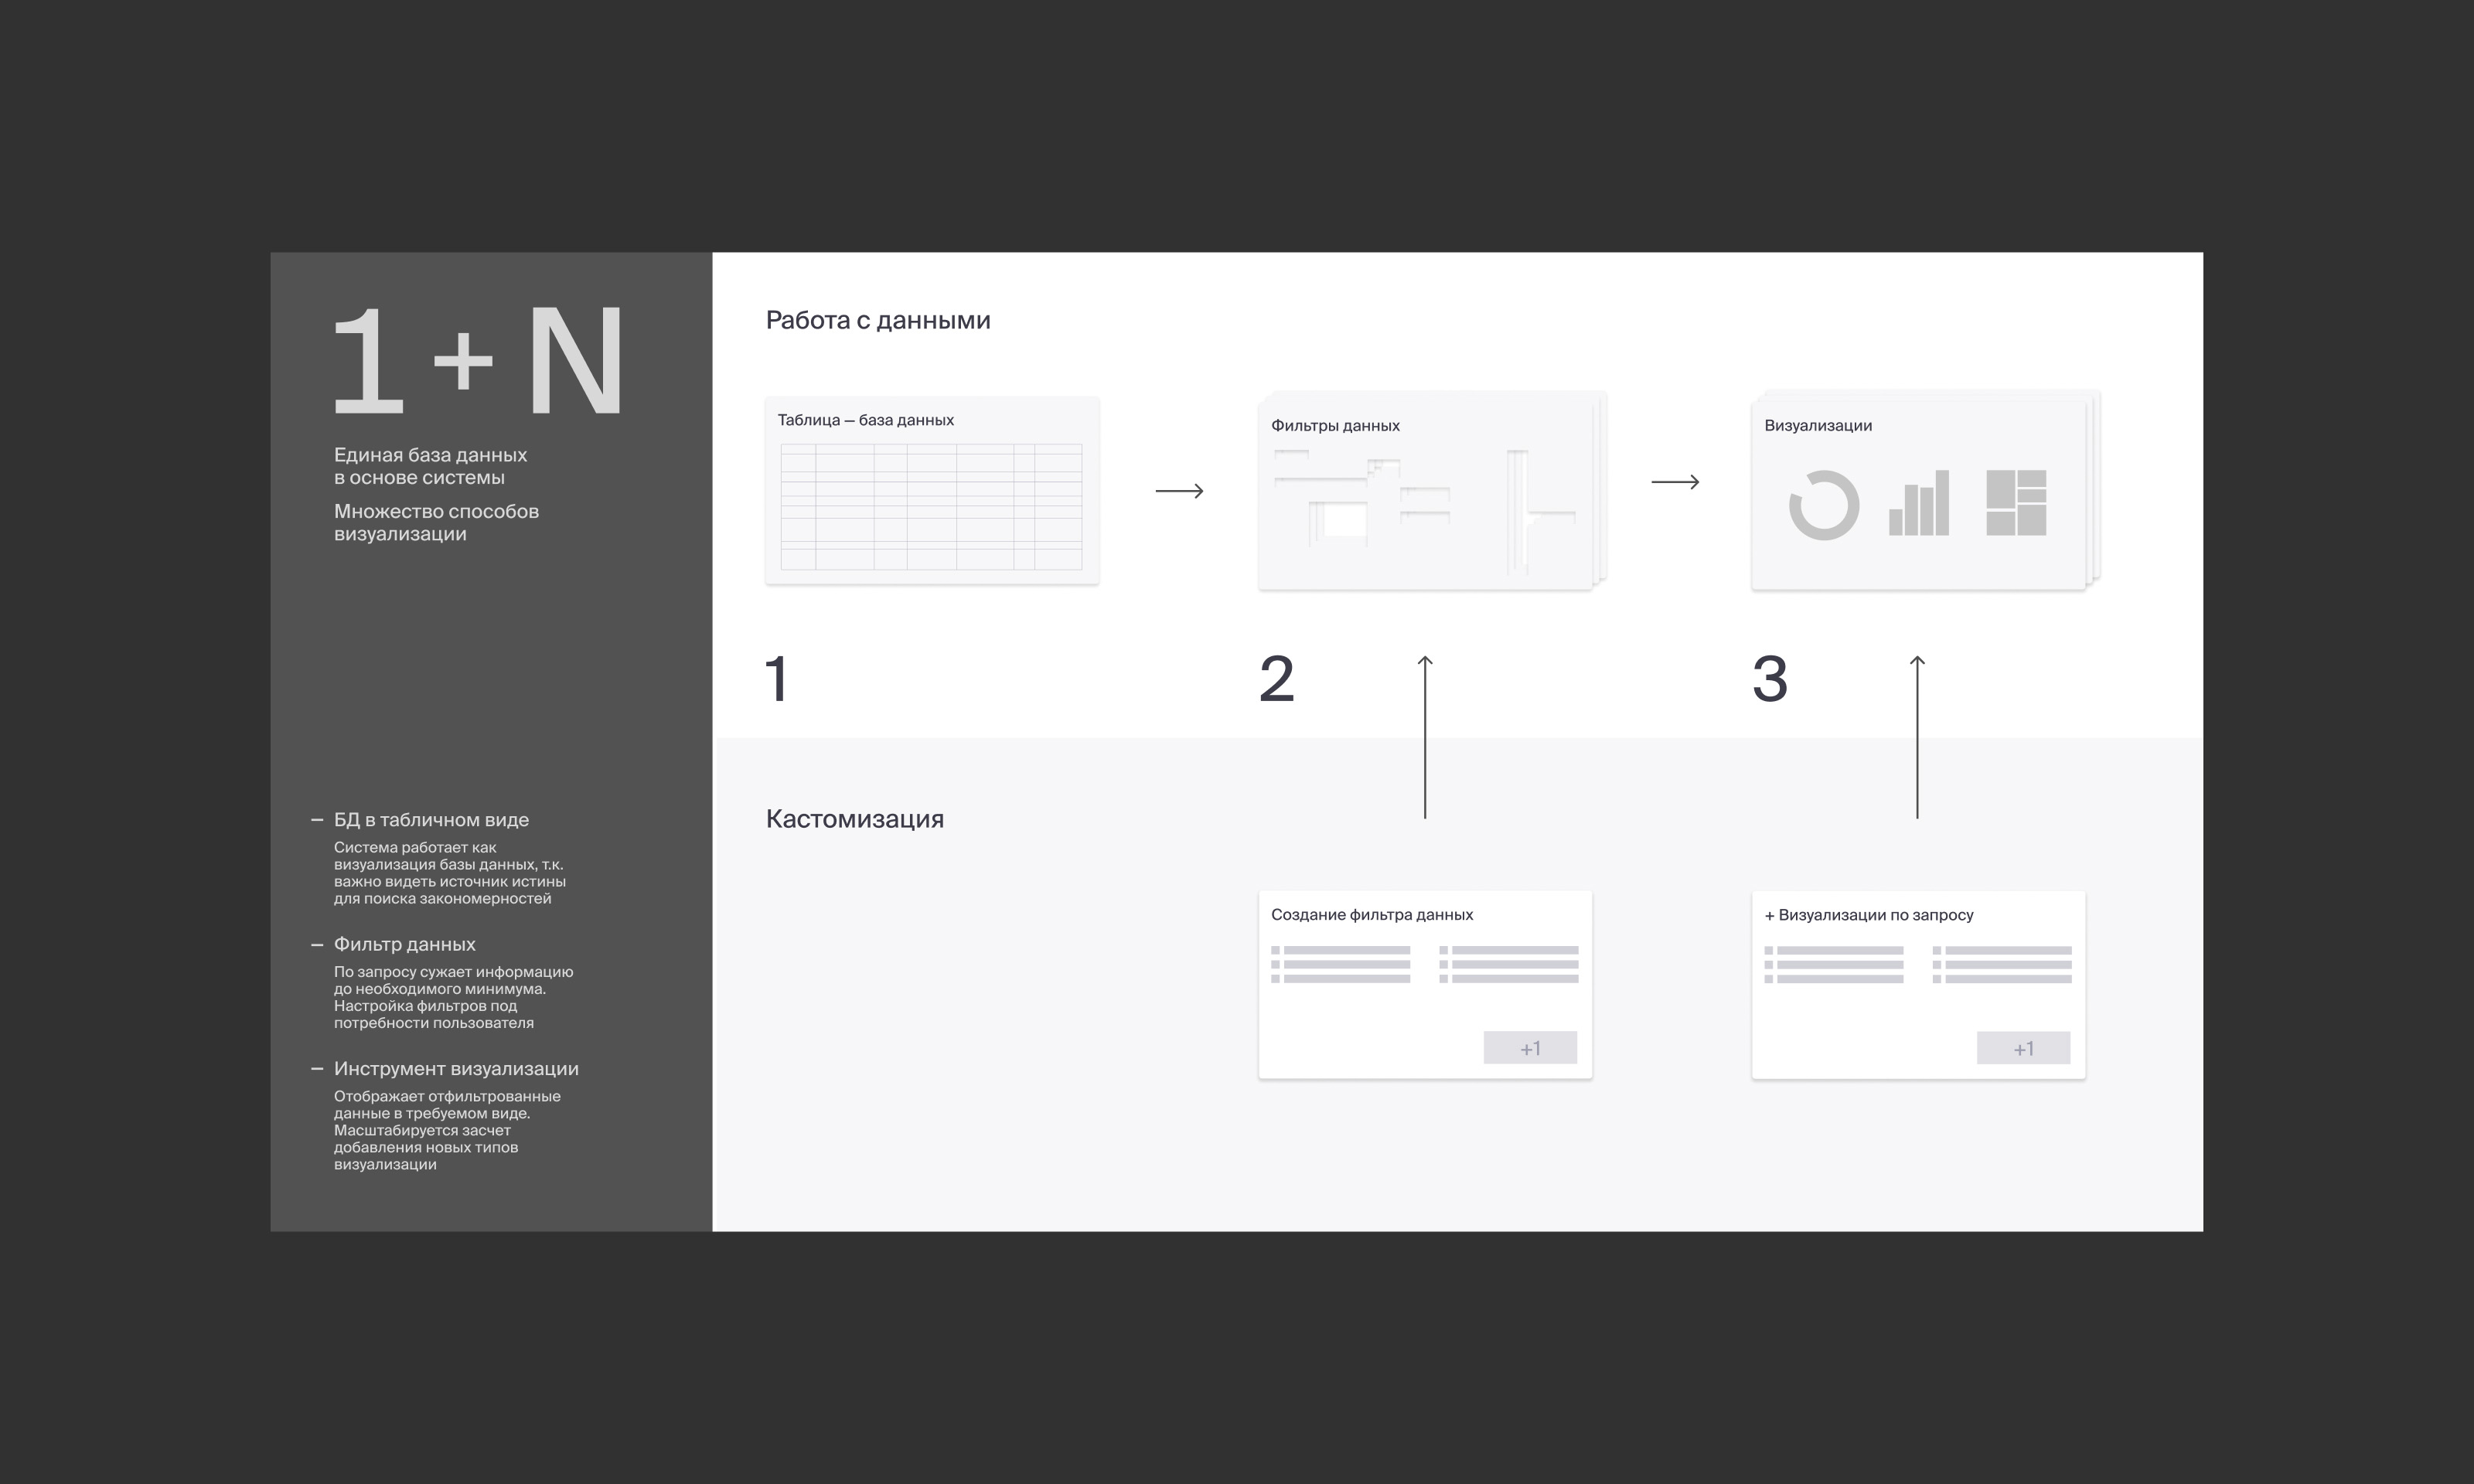
1+N monitoring

Customer
Year
Role
Context
Gazprom CPS
2020– 2021
Art-director
Formation of the concept of the internal product, search for a business-model
About the project
Internal cloud service for monitoring the status of corporate construction projects and facilities. Target audience — managers who need an overview of the project portfolio and the specific situation on the ground, broken down by contractors and tasks. Automation of problem signals, decomposition of problems into local and general, consolidation of data into a single catalog. A separate project-satellite is a dashboard on the statusYan and repair progress at facilities.
Situation at the start
1.
The interface concept has been formulated in general terms and is being refined on the fly.
2.
There is no full cycle development team
3.
Decision makers are not available for feedback, there is no dialogue
3.
Cutting into small sprints and OKRs allows for flexible task planning
Results of the work
Effect
1.
Conceptual model
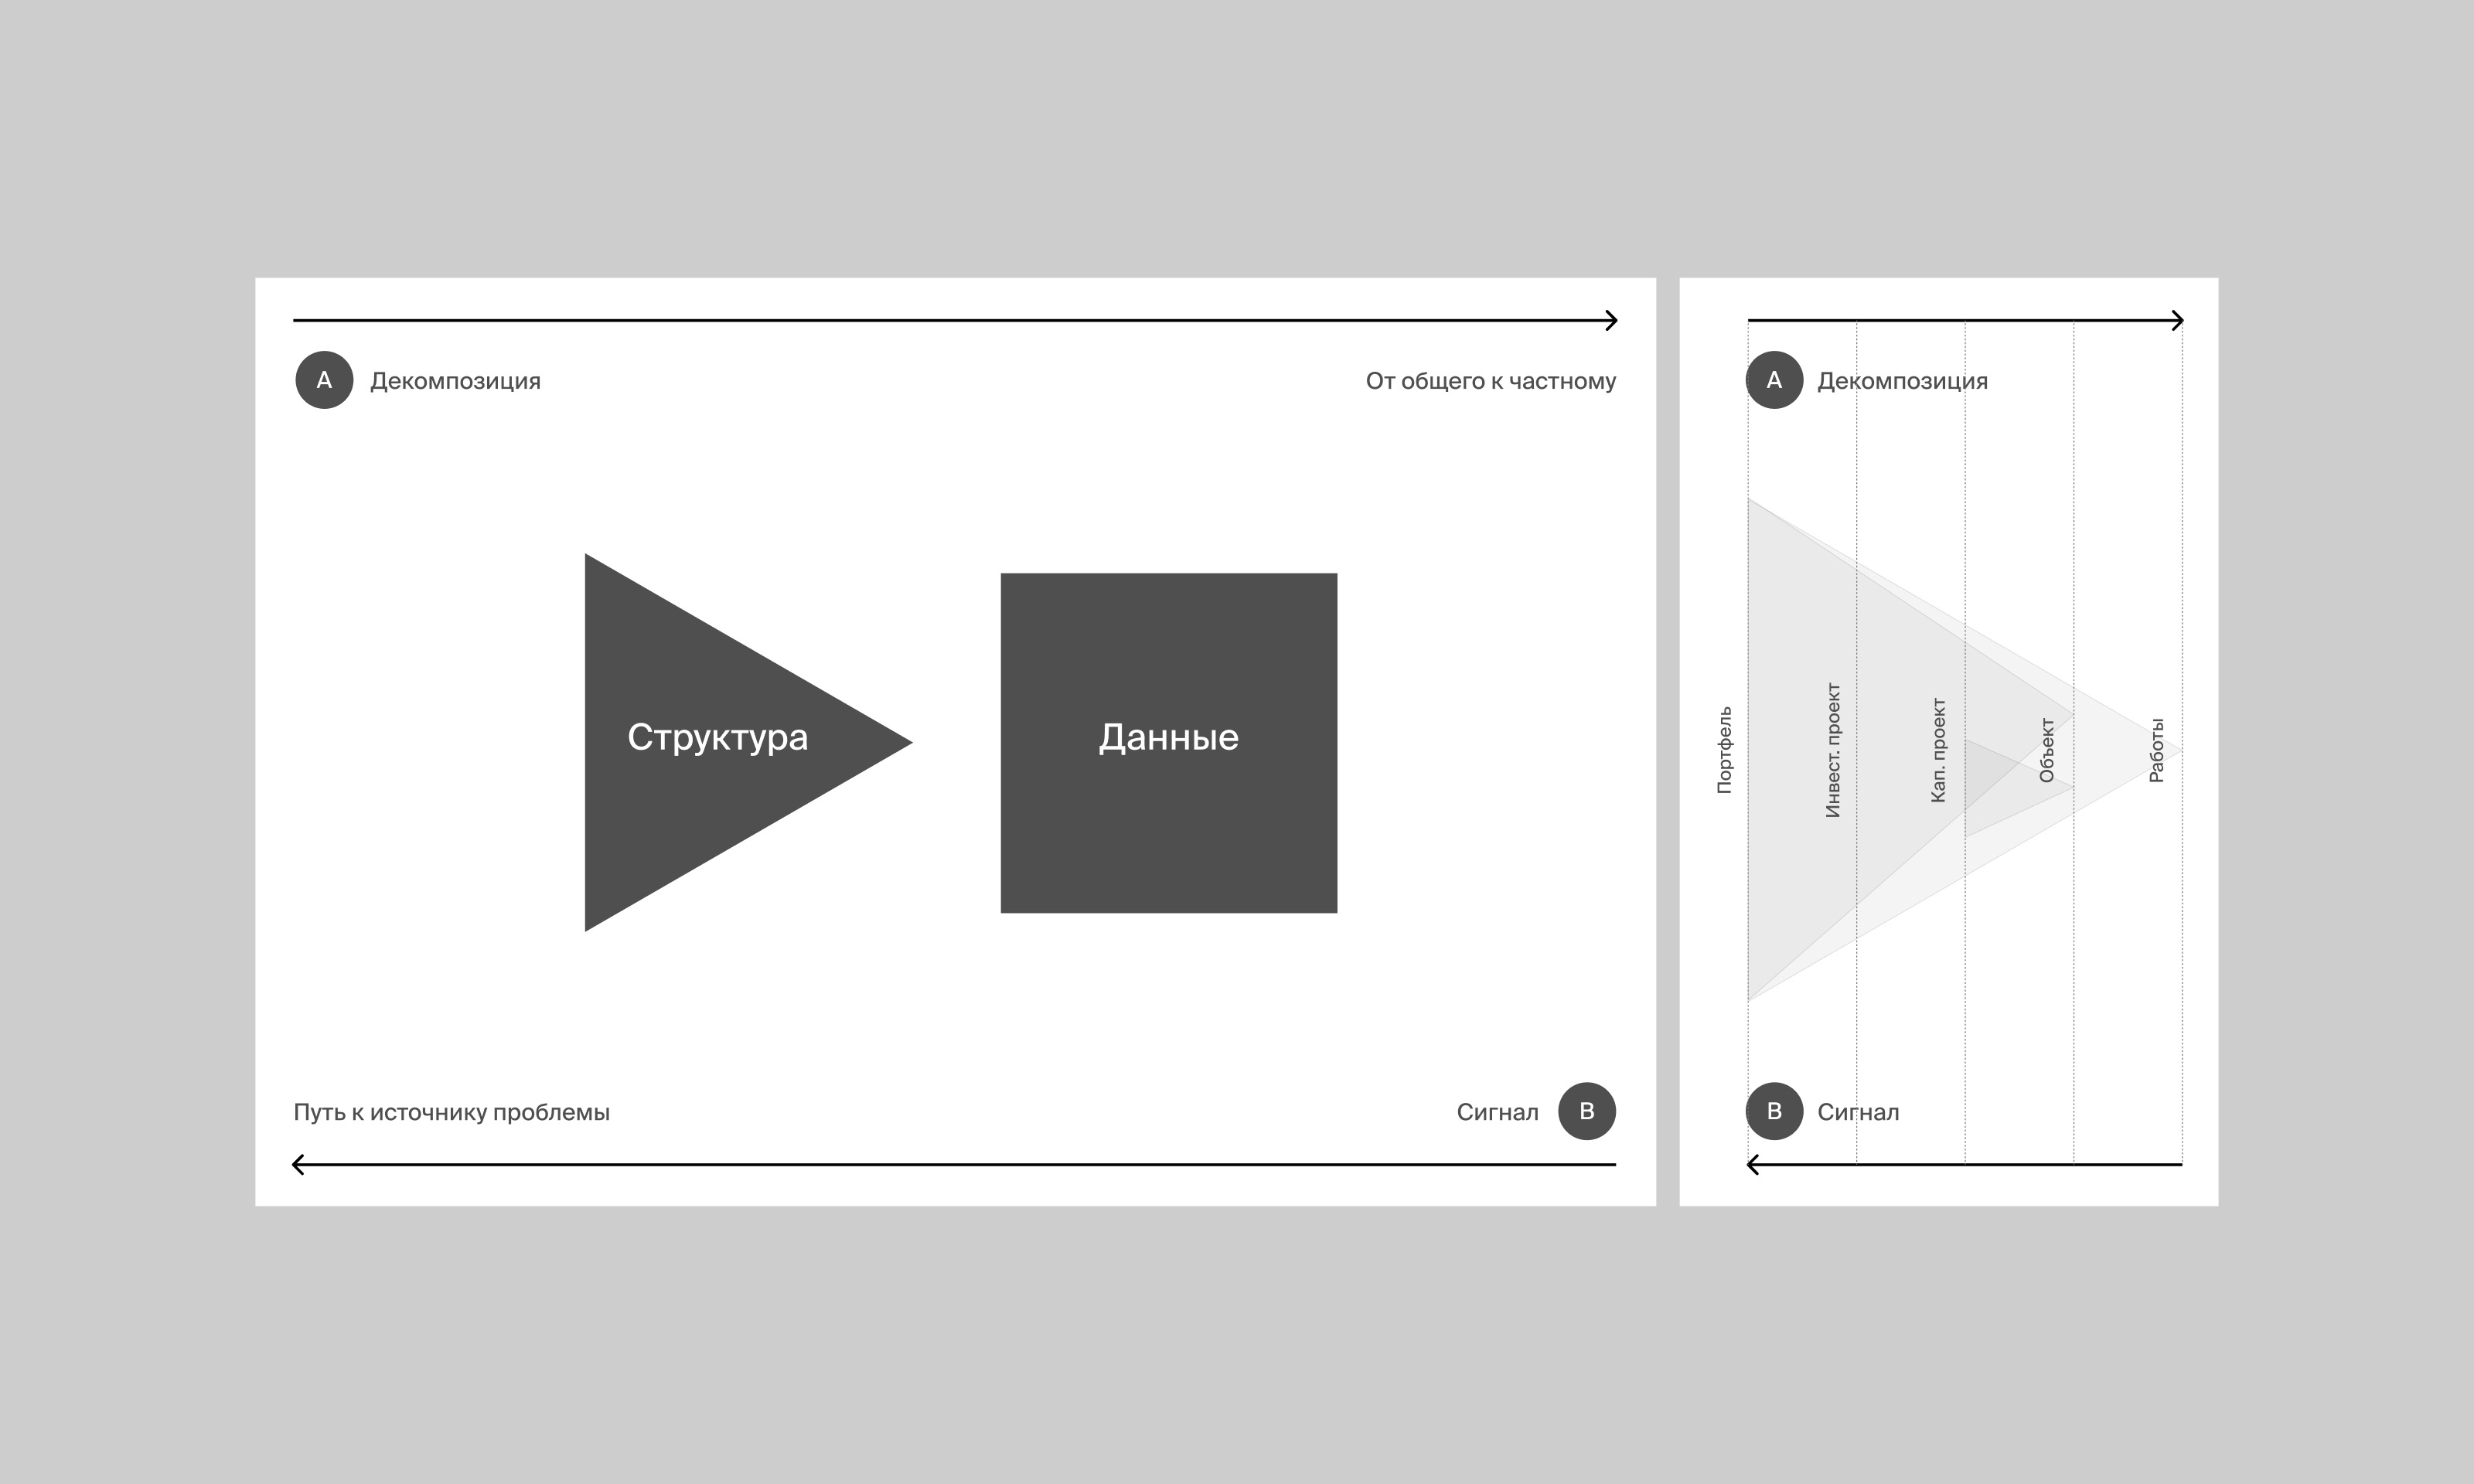
The basis of the — project is data decomposition and cross-cutting signals about problems on projects. In addition to signal navigation, I set constraints on the interface, dividing it into three levels and a linear navigation structure.
Signal navigation simplifies the search for the source of the problem, since all data is accumulated and displayed at higher levels in the interface. It is possible to quickly go from an investment project to a specific complexity at a construction site with a specific subcontractor
It is immediately clear where to put new features and requirements, which saves time on decision making
The product has a clear and simple concept that can be explained in a minute.
The product is easy to present to management and, as a result, find a budget for further development
2.
Organizing a space for team work
In Figma, I organized files using a system that is convenient for several designers and structured the team's work by assigning functions to each designer.
From the very beginning, I built my work in Figma on a component base.
The distributed team worked remotely efficiently, increasing or decreasing the workload as required
Project scalability: from prototype to target version, mockups evolved, there were no refactoring costs
3.
Design layouts
Assembled the overall image, look&feel of the product, taking into account corporate branding. Designed the main user scenarios on all three interface levels. Designed the concept of the project-satellite for monitoring the stateYanof repairs at facilities.
Layouts in the target form are available to businesses at a distance of one click
Supporting corporate branding and the right degree of innovation allowed for effective product presentations to management
Widgets allow you to scale and assemble dashboards with a set of data for a specific task
Convenient to use on large touch panels thanks to navigation located at the bottom
4.
Widgets
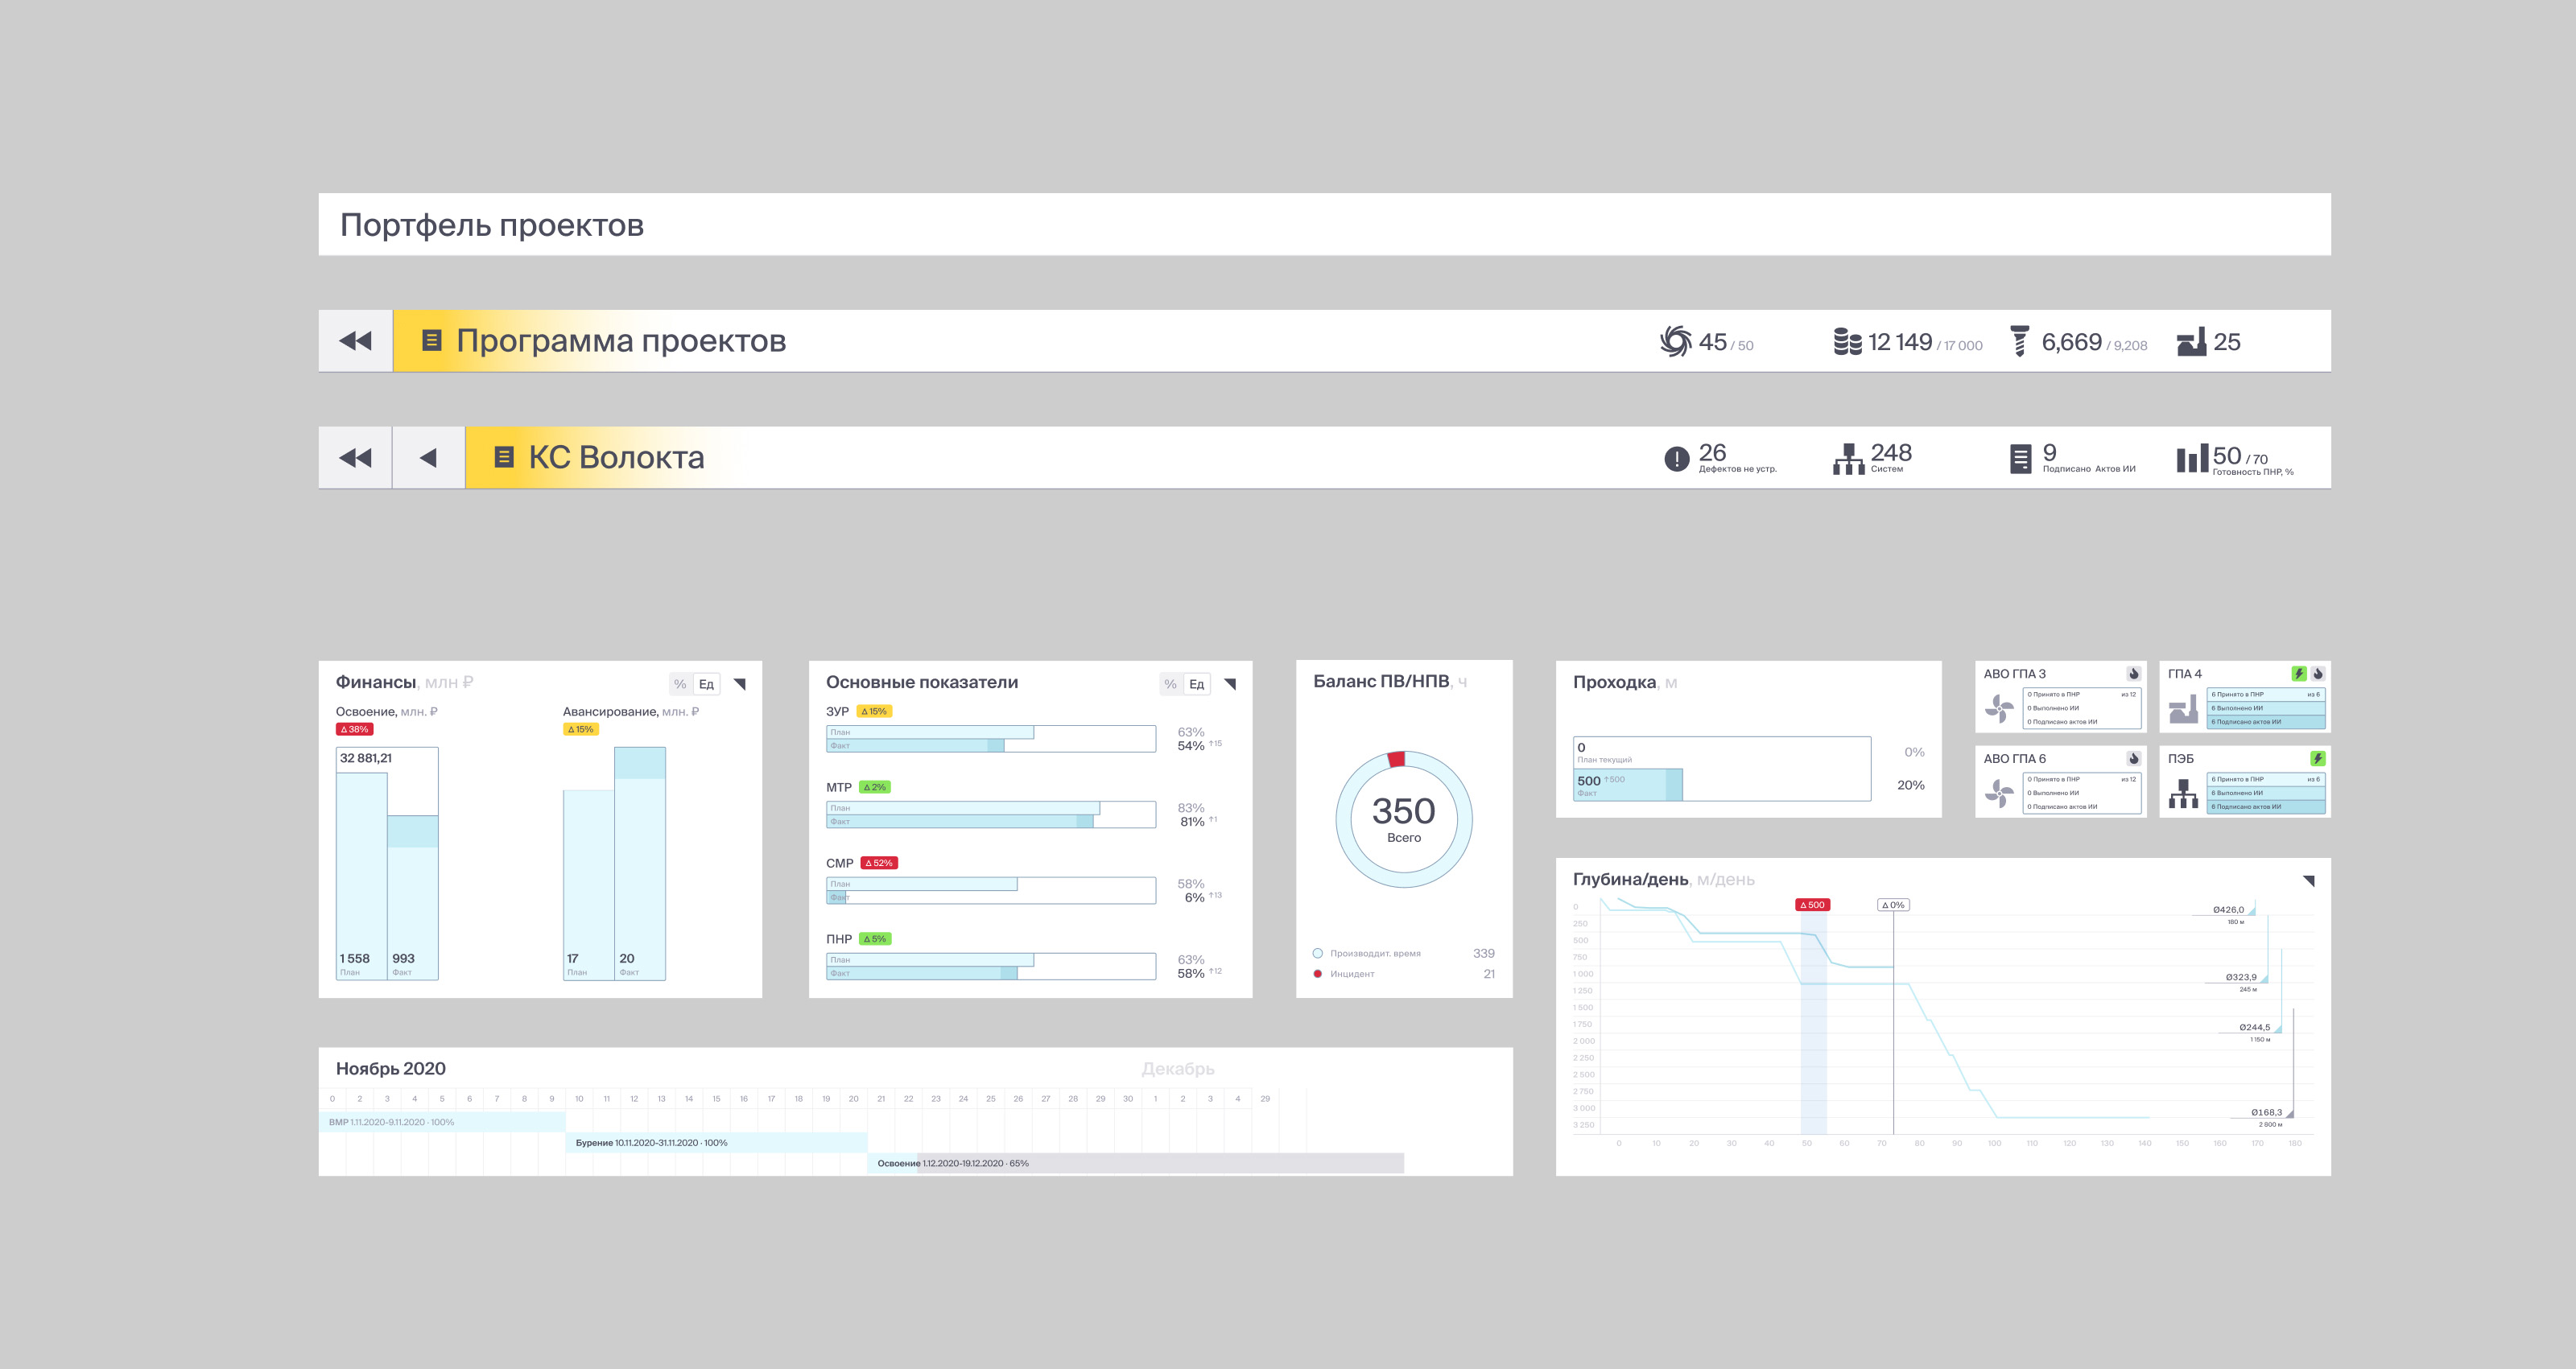
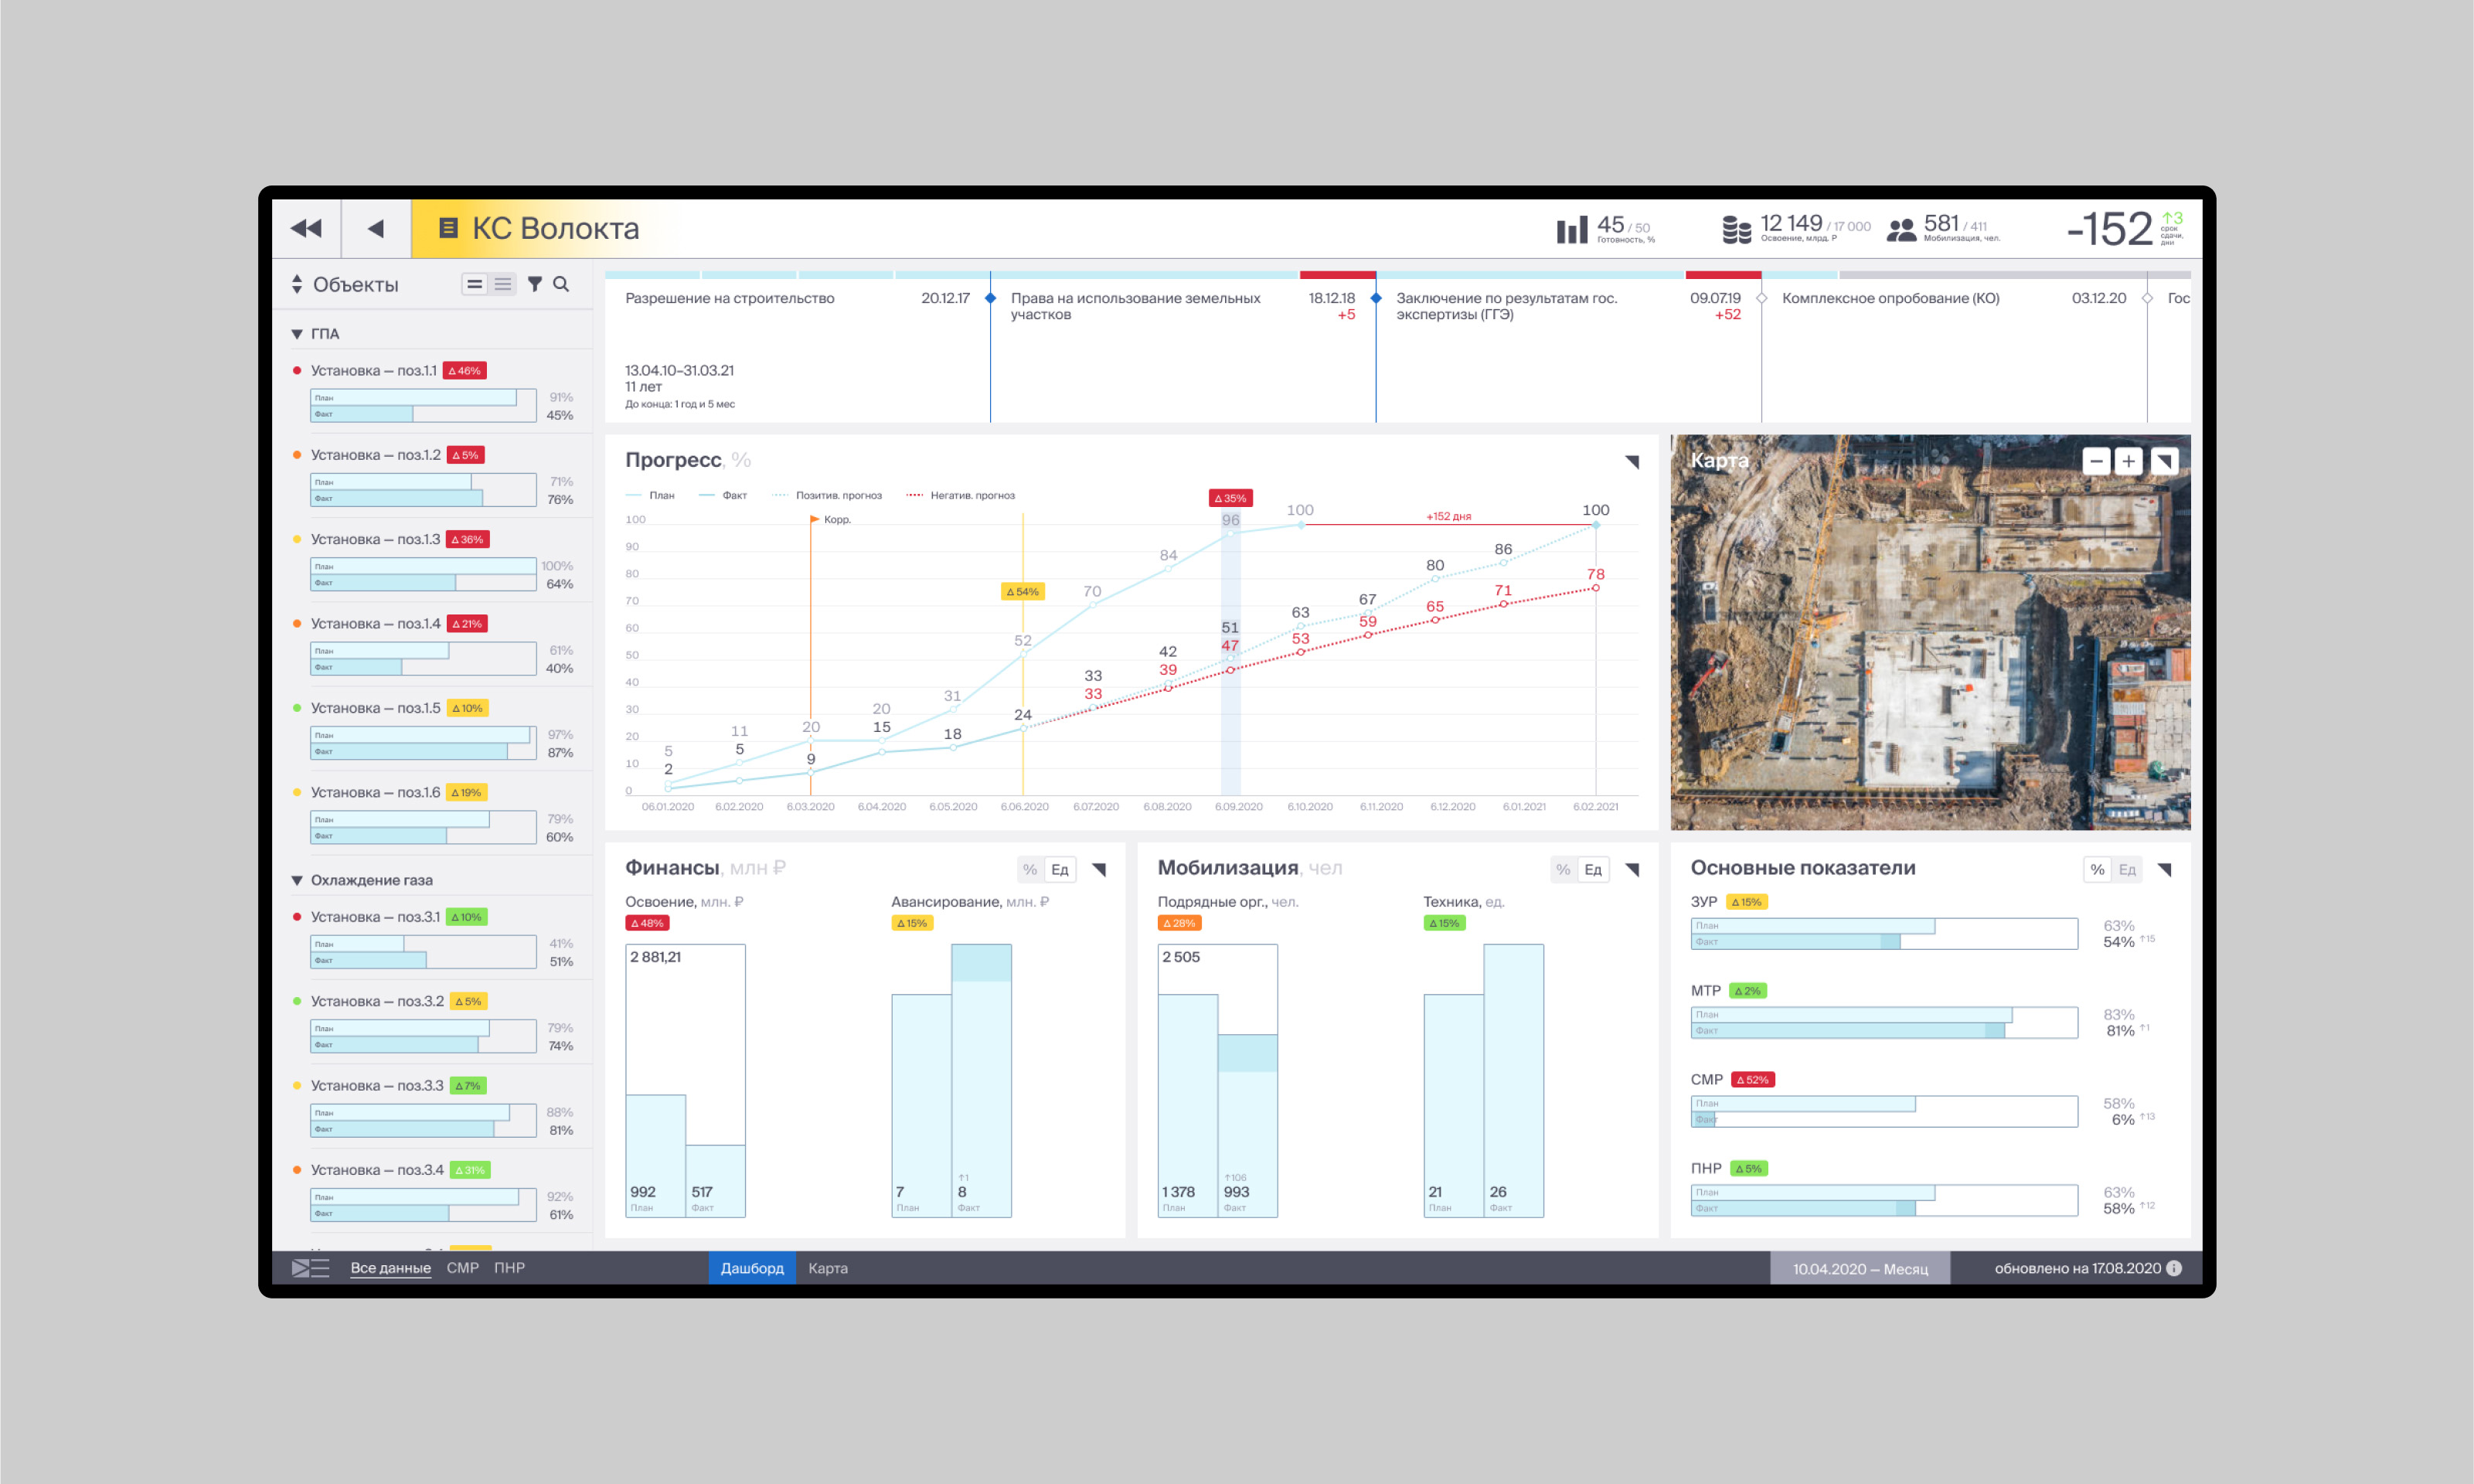
The interface works on a widget system. Designed the main widgets for monitoring the situation and thought out a system for developing new ones. Each widget has a compact, normal and full-screen size.
Widgets allow you to scale and assemble dashboards with a set of data for a specific task
The user receives the necessary detailing and grouping of data upon request, from a general overview of the situation to a specific breakdown by groups of contractors, finances, types of work, etc.

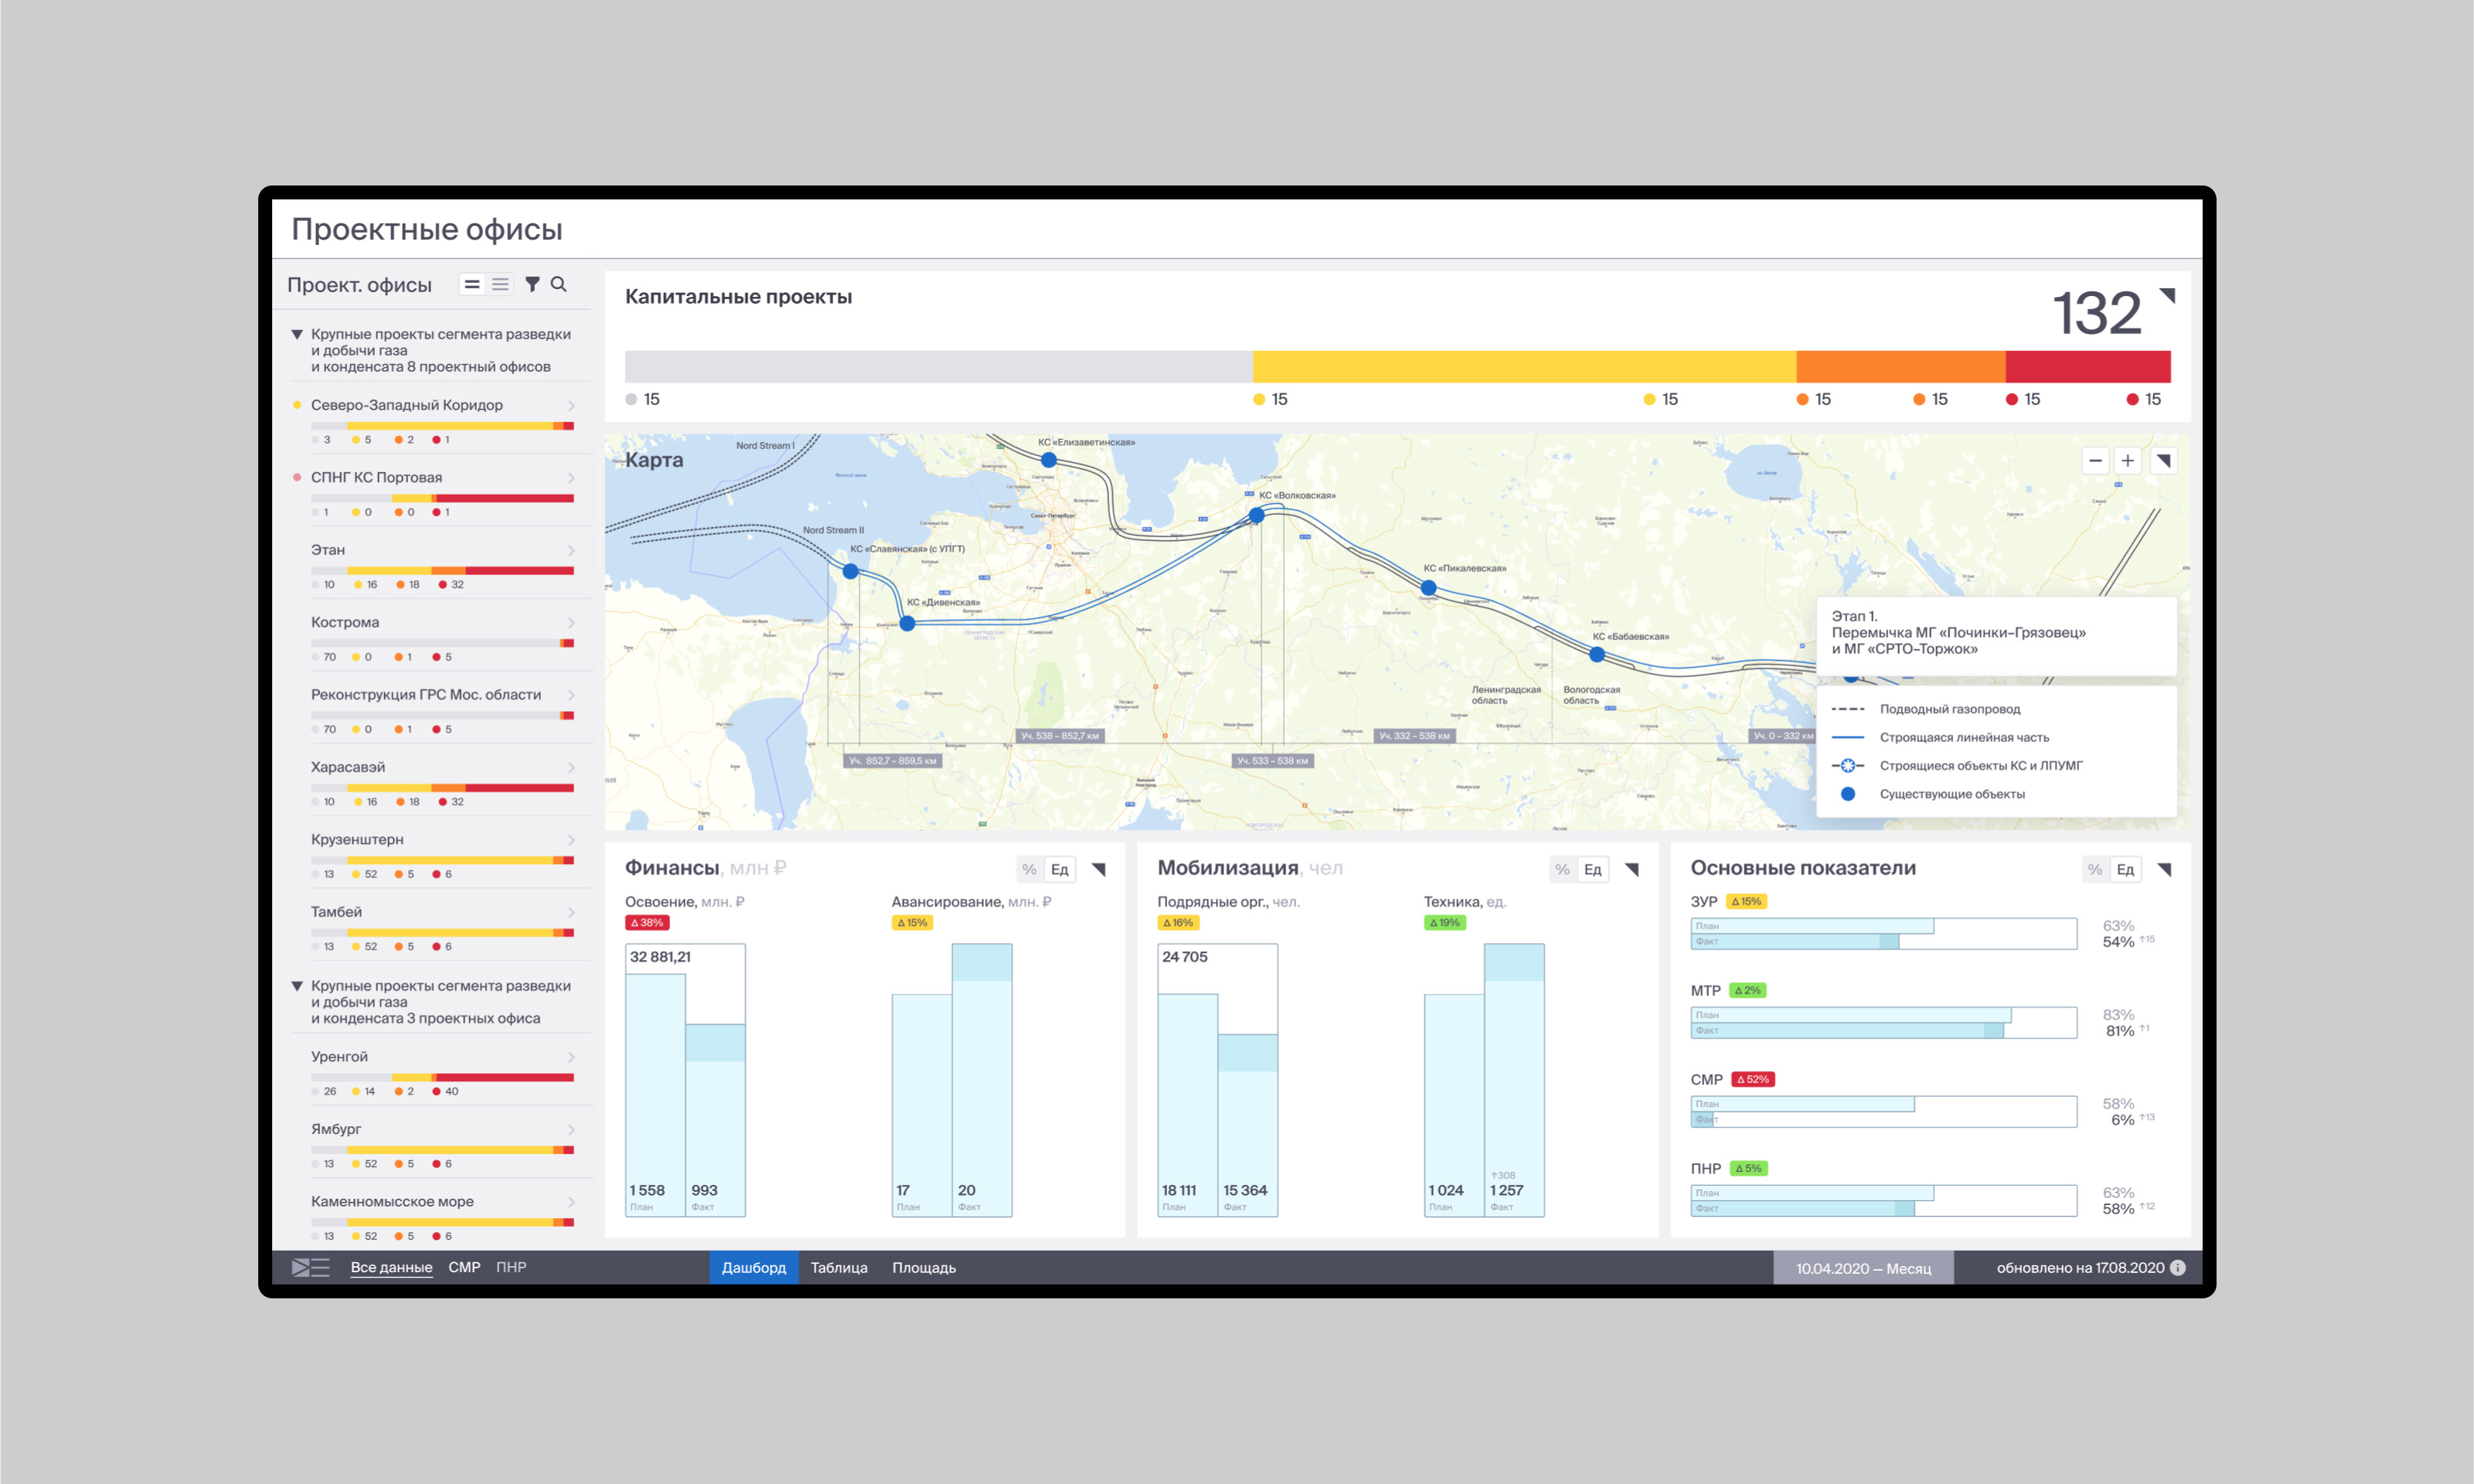
"From the general to the particular" — conceptual model of the project. Sets the rules for the interface. The entire data flow is grouped at five levels, navigation along which is strictly linear. This reduces the cognitive load on the user, and only the necessary data is always in front of the eyes.
Using signal navigation, the user has the opportunity to go from the top level down to the source of the problem that affects the process as a whole.

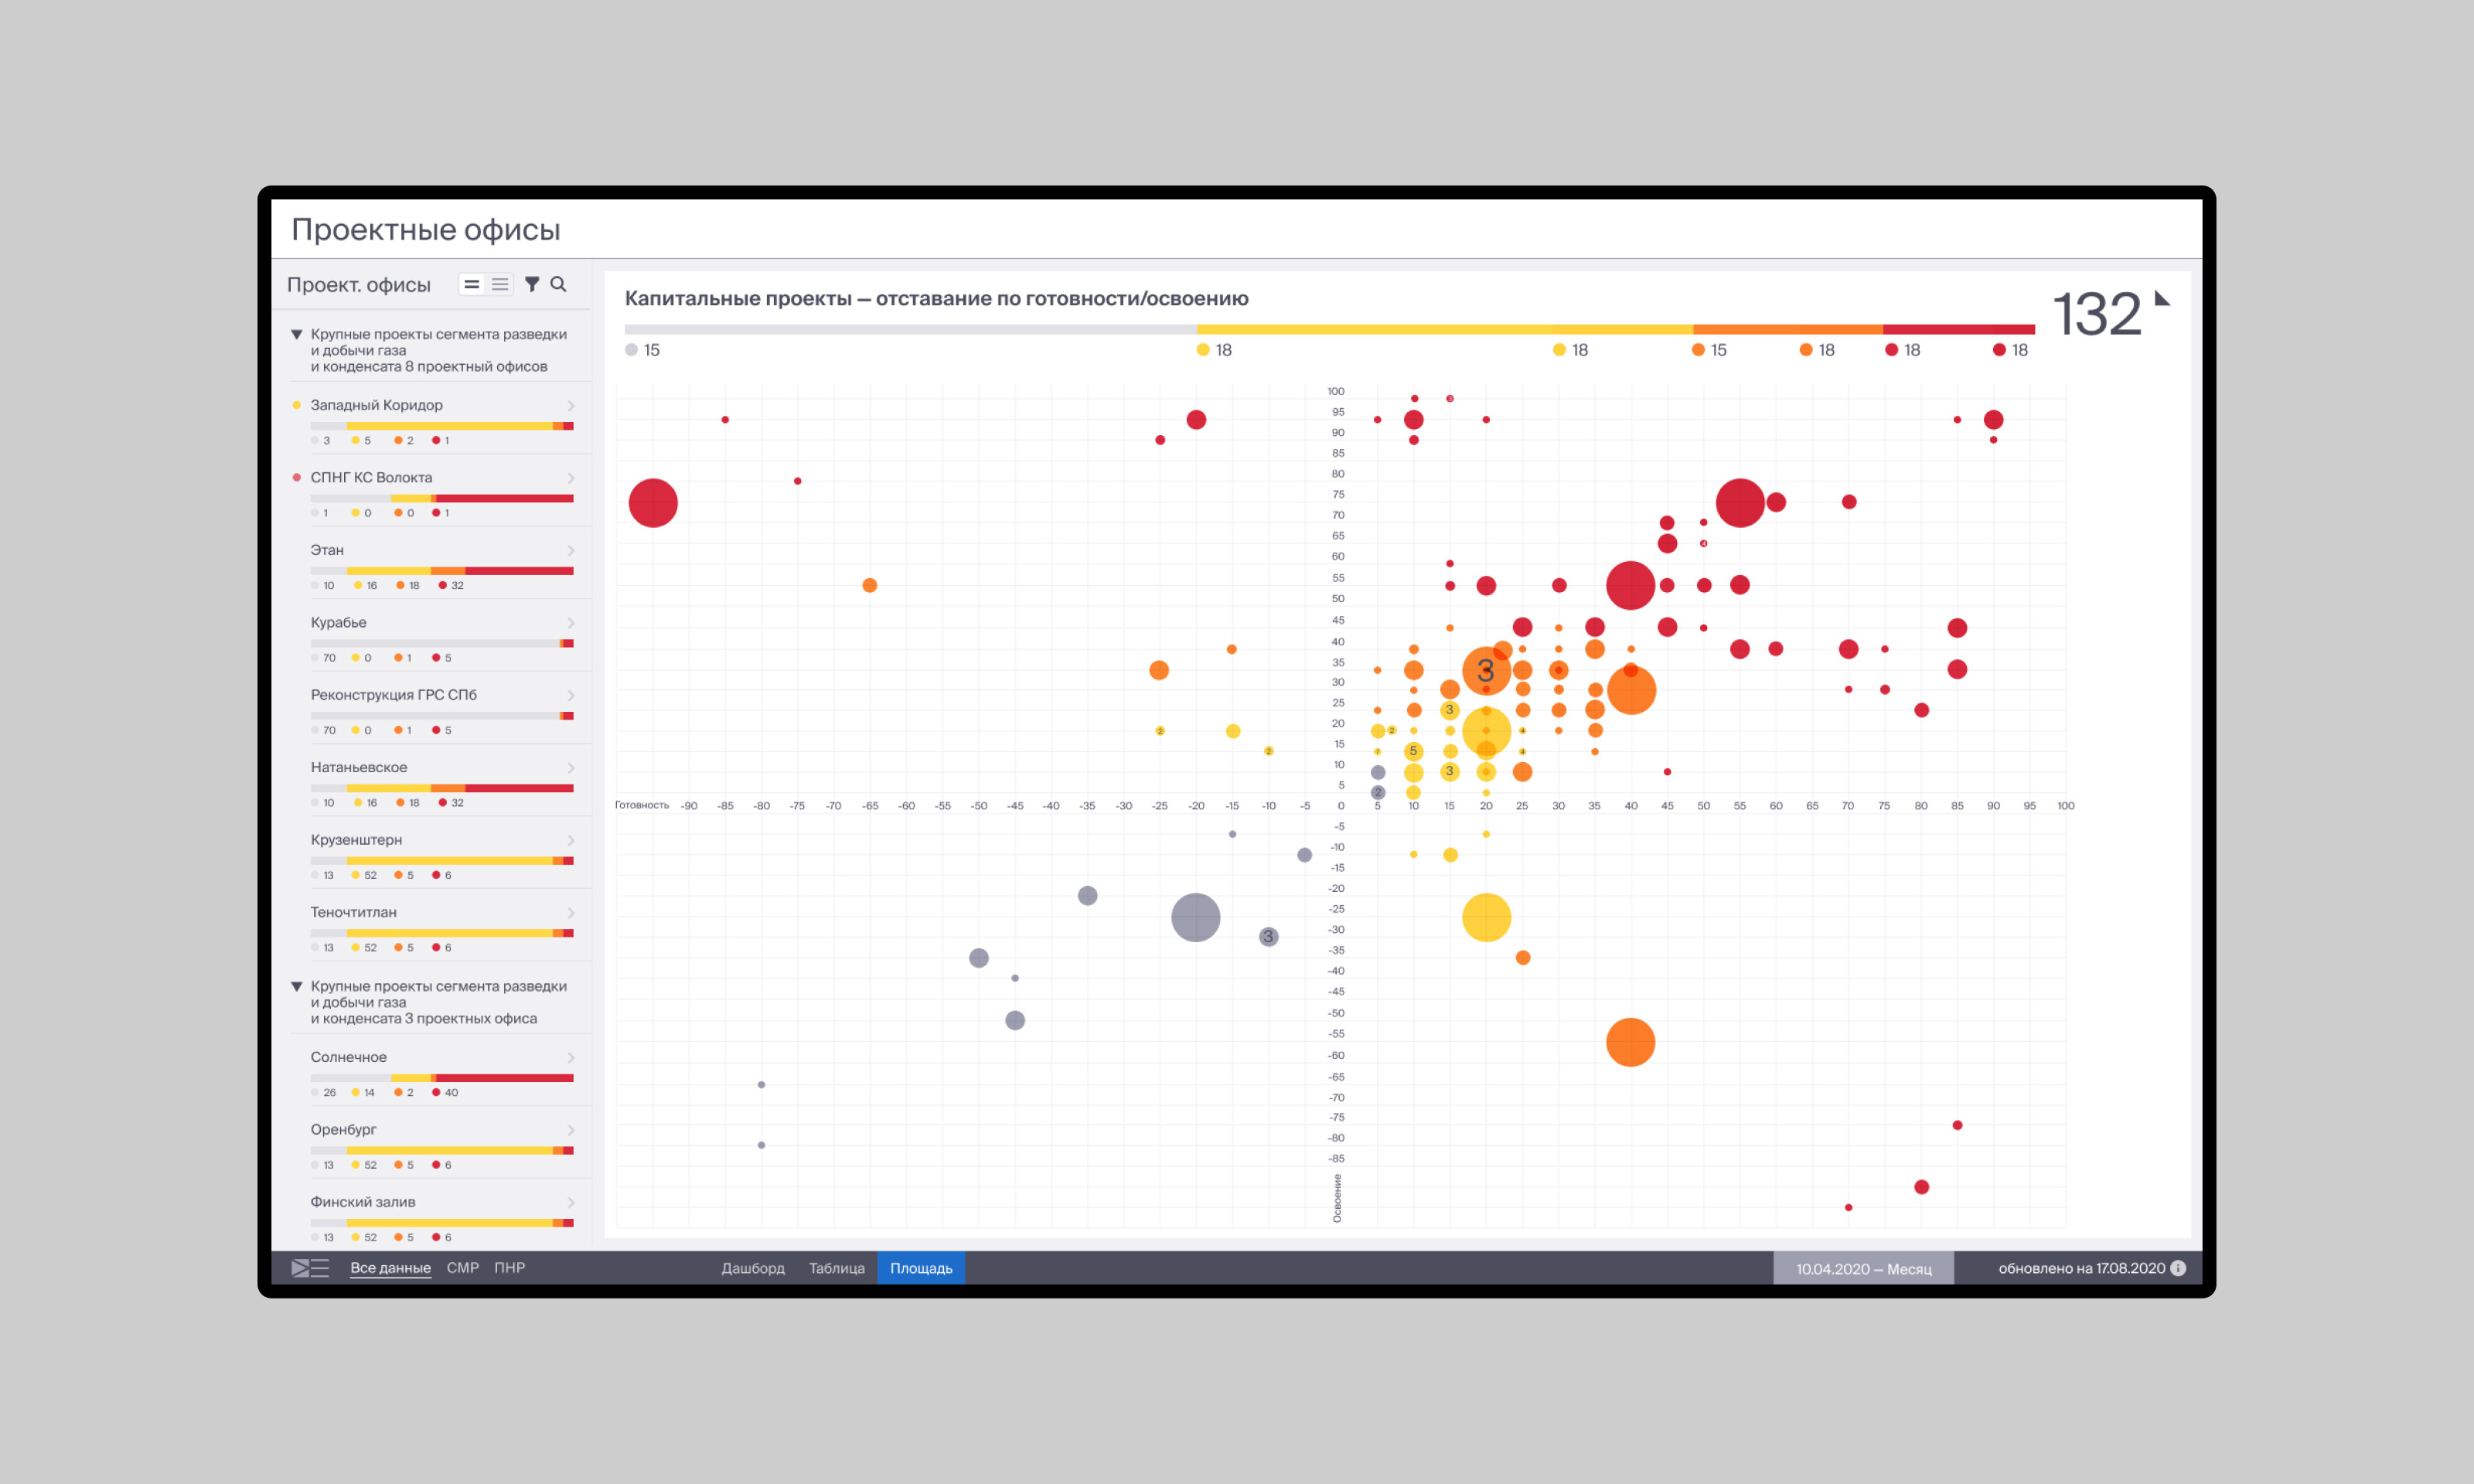
The first level of navigation is — project offices. Various data visualization widgets.
The second level of navigation — investment project. Contains more detailed data. Visualization as a dashboard or list.

The third navigation level — capital project. Detailed information about the object. After this level, the data breakdown is already by contractors, specific widgets are responsible for it.

Selected set of — components: top statusbar and widgets.

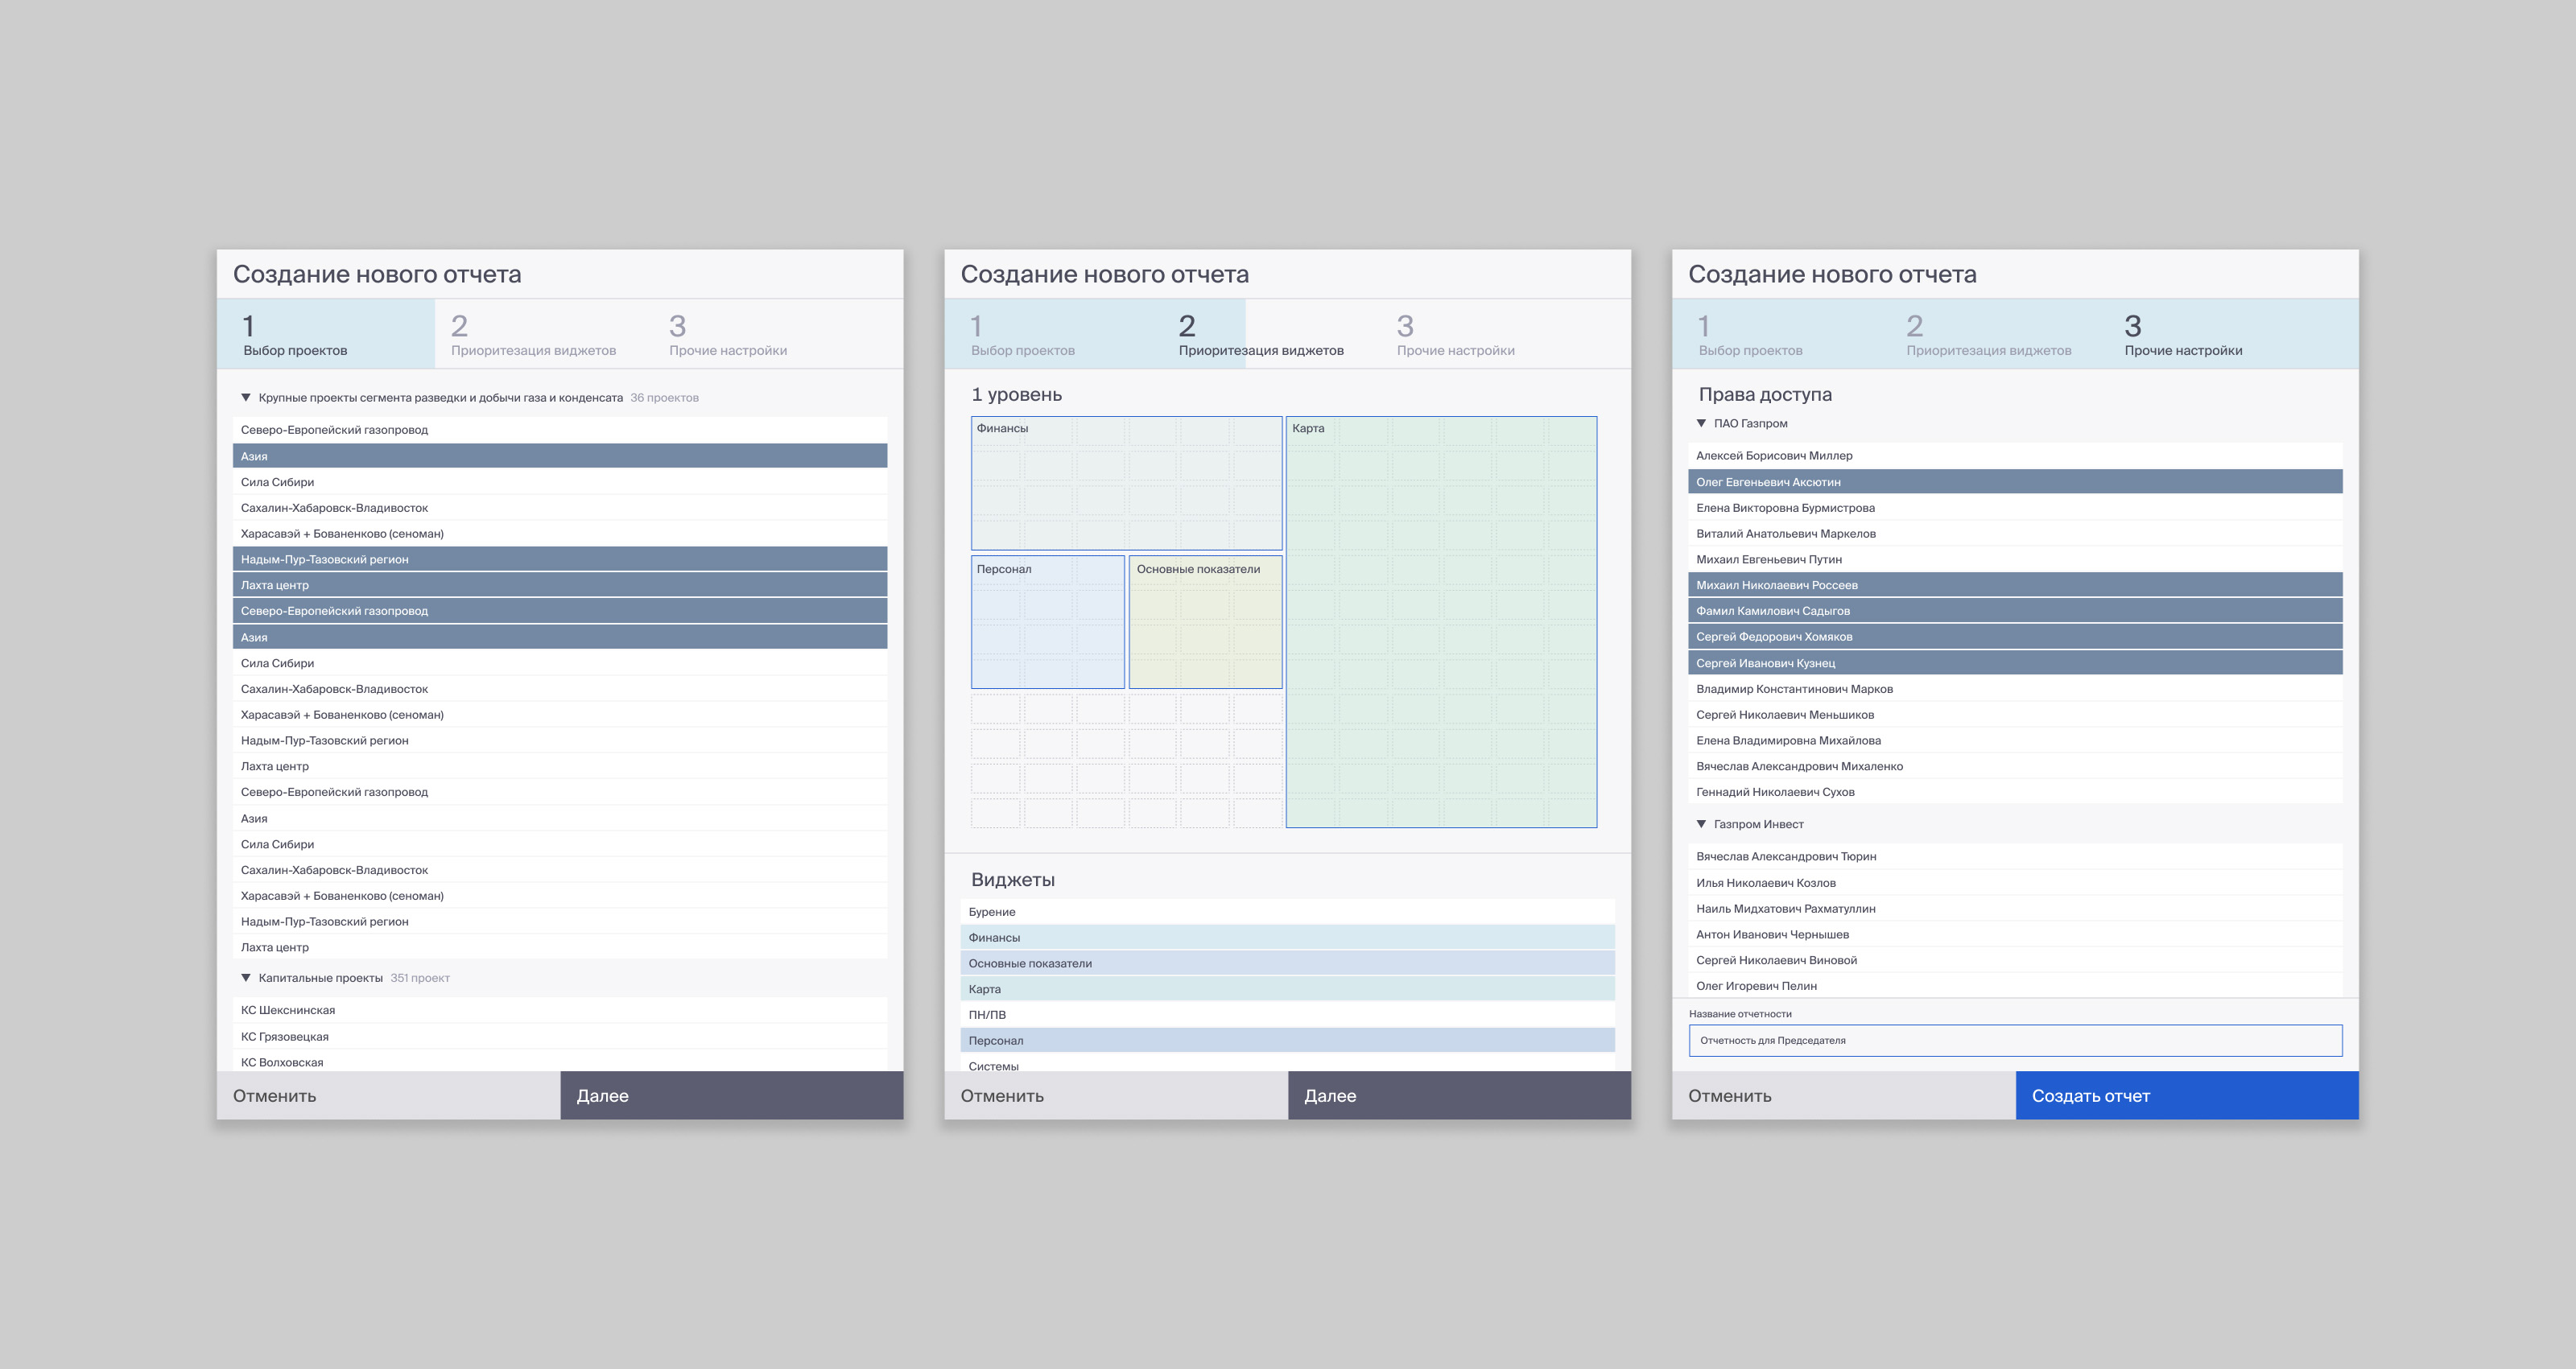
Report assembly panels. The version was not put into production and remained at the concept stage, approved by the customer.

Based on the reporting, a concept of a single database — manager dashboard was designed in a sketch. It consists of widgets displaying the most important information on selected filters. User — senior manager.
Widgets are customizable, and the interface was designed for large touch panels in the corporation's offices.
The project remained at the level of the concept agreed upon by the customer.

Project design-team

Other regularYancustomers

Customer or project
Year
Role
Context
GRAD
2025 ← 2020
Art-director
Launch of a service for geologists, the stage of hypotheses and active development
St. Petersburg Digest
2025 ← 2018
Art-director
Launch of a periodical, design-layout and concept formation
Praxis Group
2024 ← 2019
Art-director
Leading project teams, creating concepts for annual reports
1+N
2021 ← 2020
Art-director
Concept and design of corporate monitoring system
NWCC
2020 ← 2014
Art-director
Supporting the company in the communication and digital environment
Mad Espresso Team
2015 – 2020
Art-director
Launching a coffee shop, forming a concept, scaling
Loudy
2019
Senior designer
Launching a music startup, forming a business-model
Grower Cosmetics
2019
Designer
Ecological cosmetics branding, launch and development
MuseumFabergé
2018 ← 2014
Designer
Development of the museum after opening, launch of temporary exhibitions and events
Cascara
2017
Art-director
ERP system for managing a chain of coffee shops. Web + iOS application
Terminal Design
2013
Designer
Project work for agency clients
Erarta
2012 ← 2010
Designer
Opening of the museum, formation of new directions